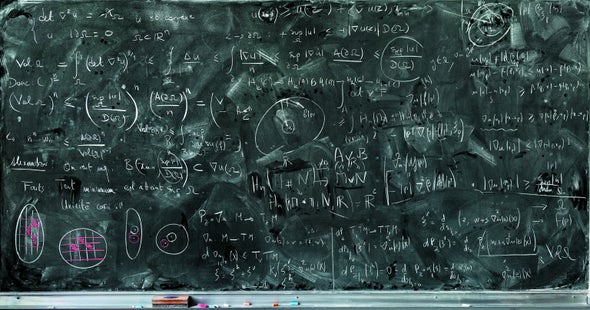
Even when it is inscrutable, math is beautiful. Photographer Jessica Wynne set out to capture this appeal when she began photographing mathematicians' chalkboards around the world in 2018. “I've always been interested in entering into worlds outside my realm of knowledge,” Wynne says. Without comprehending what the math on the chalkboards represented, she was able to appreciate it on a purely aesthetic level. “It's a similar feeling as when I'm looking at an abstract painting. But it added more interest that beyond the surface there's great meaning and great depth, and they're trying to reveal universal truth.”
Wynne was first drawn into the world of math when she befriended two mathematicians who vacationed near where she spent summers on Cape Cod. As she learned about their research, she found many parallels between the process of math and the process of art. “I was really surprised to witness how they work and how creative what they do is,” she says.
As Wynne began to travel to different universities to meet more mathematicians, she discovered how diverse their chalkboard styles are. “Some were very clean and neat and very carefully considered,” she recalls. “And some were just this explosion and chaos. The chalkboards almost felt like portraits of the person and depended on the personality of the mathematician.”
Many of the photographs will be collected in a book, Do Not Erase: Mathematicians and Their Chalkboards, forthcoming in June from Princeton University Press. Wynne intends to continue the project, especially because her travels were cut short by the pandemic. She had planned to visit the mathematics department of the University of Cambridge until she learned that their chalkboards had all been replaced by dry-erase and digital boards. “I'm very attracted to the whole analog nature of working on a chalkboard,” she says. “I noticed a lot of places were getting rid of their blackboards, and I felt an urgency to document this.”
Mixed Gaussians
Physical measurements (such as the heights of women chosen randomly from a population) will commonly produce a distribution called a Gaussian, a plot that looks like a rounded mountain. Machine-learning algorithms are often given heterogeneous data (for instance, the heights of random women and men), and a challenging task is to disentangle the measurements into two or more components. Ankur Moitra of the Massachusetts Institute of Technology and his colleagues discovered a way to separate the curves that requires only the first six “moments”—special characteristics—of the mixture. “What I drew on the chalkboard is the key proof in our paper,” Moitra says. “It turns out that this is equivalent to being able to take two different mixtures, subtract them, and show that the resulting function crosses the zero axis at most six times.”
Branching Waves
Stick-figure-like diagrams represent snapshots of wave evolution. The white lines encode the locations of peaks for a configuration of shallow-water waves at a particular moment in time. “These waves have interesting interactions,” explains Harvard University mathematician Lauren K. Williams. “For example, two waves can meet and form just one wave coming out, and if one lets the time vary, one sees different patterns of wave interactions.” Williams and her collaborator Yuji Kodama of the Ohio State University used the diagrams to study solutions to the so-called Kadomtsev-Petviashvili (KP) equation describing wave behavior. They found that the wave patterns that arise from a certain class of solutions can be classified by triangulations of a polygon (in yellow). “If one changes the parameters of the solutions a bit, these wave patterns can degenerate and form, for example, the white ‘starfish’ pattern shown at the center,” she says. At the bottom left is what Kodama and Williams call a “Go-diagram,” named after the board game Go, played with black and white stones, which they use to study certain solutions to the KP equation.
Out for a Walk
Each colored line shows the path a pedestrian takes through a square grid in this “vertex model.” The walkers' paths cannot overlap, so whenever two meet they must decide which way each one will go. The decision might be biased—for instance, walkers of cooler colors may be more likely to go east than north compared with walkers of warmer colors. “In spite of its simple description, its large-scale behavior is intricate and closely related to a number of mathematical and physical phenomena,” says Alexei Borodin, a mathematician at the Massachusetts Institute of Technology. Vertex models can be expanded to include many more walkers and many more colors. “A combination of deceptive simplicity, hidden depth, and efficacy of mathematics in the analysis makes this system attractive to me.” Borodin also likes “the aesthetics factor,” he adds.
Organized Chaos
There can be order in chaos, it turns out. Between 1999 and 2003 Helmut Hofer of the Institute for Advanced Study in Princeton, N.J., and his colleagues developed a field to study this order, called symplectic dynamics. Hofer's board depicts “finite energy foliations” (white lines)—tools for characterizing the chaos in a dynamical system such as a satellite moving between Earth and the moon. This intricate system of surfaces relates to the evolution of a satellite's position and momentum as it interacts with the gravity from the two planetary bodies. Hofer hopes that “this much better understanding of the chaos will ultimately have applications in the design of space missions.” For instance, earlier efforts used insights about chaos to preserve fuel during space exploration but at the expense of added travel time. Hofer suggests this new work could further boost fuel savings without lengthening a mission's duration.
Matching Shapes
A coffee cup and a doughnut are famously “the same” shape according to the mathematical field of topology, which categorizes surfaces by how many holes they contain. Because both the cup and the pastry have a single hole and could be bent and stretched into the same shape without making any cuts or perforations, they are topologically identical. Similarly, the two surfaces labeled “2,” as well as the surfaces labeled “6,” are fundamentally the same. “They are a lot of fun,” says Nancy Hingston, a mathematician at the College of New Jersey, who studies paths on such shapes in her work on differential geometry.
A Collaboration
Chalkboards are often the best tools for mathematical collaborations—visual and tactile places to merge two people's ideas and instincts. Mathematicians John Terilla of Queens College and Tai-Danae Bradley of X, the Moonshot Factory, were attempting to understand the hidden mathematical structure at work in natural language. “That was the first time we spoke about formalizing that structure in a particular way,” Terilla says. “Tai and I were working together at the board, and it shows both of our writing. The large ‘There exists [denoted by ] a functor F,’ for example, is mine; the ‘hom(alpha, beta) in [0,1]’ below that is Tai's.” This research is part of a general quest of Terilla's to search for “what's at work behind the scenes to understand what's going on,” he says. “Going up a level in abstraction to explain something is a bit like going out of your way to climb a hill and look around—useful in research since it can show the way forward in uncharted territory.”
Decoding Topology
Terilla and Bradley also collaborated with mathematician and data scientist Tyler Bryson on the textbook, Topology: A Categorical Approach. They had discussed how best to present the material, and their board represents some of the content they aimed to communicate. “What’s on there isn’t research—it’s all standard mathematics that a typical Ph.D. student would learn in a topology class,” Terilla says.
In Progress
University of Michigan electrical engineer and computer scientist Laura Balzano studies mathematical models for machine learning and signal processing. “On this particular day two students and a colleague and I were sharing ideas on several different problems,” she recalls. “In fact, the top-left part of the board makes little sense to me now. The bottom-right part of the board is something I’m still working on, one year later, with little progress. Much of the rest of the right board is published now!” To the uninitiated, the last section of the board at the bottom left may be no more unintelligible than the rest, but that part, Balzano says, was a drawing by her then 2.5-year-old daughter. “Chalk is a great way to keep her occupied—for at least 15 minutes.”
Infinite-Degree Maps
Start with a function, or f, defined in terms of a complex number, or z. When a number is complex, that means it includes an imaginary component—that is, the square root of –1. Then iterate the function for successive versions of z to create the orbit of the function. Next take points close to z and look at their orbits. This process describes the dynamical system for the function. Linda Keen, a professor emerita of mathematics at the Graduate Center, City University of New York, is interested in the dynamical systems for functions of infinite degrees. “I have been interested in infinite-degree maps,” Keen says. “These pictures are meant to help understand what happens when you change an f that is infinite degree.”


